


4 Engagement Metrics Marketers Must Measure
Engagement metrics can help measure the success and growth of your marketing or social media campaign. In marketing terms, engagement measures how much and how often people interact with you and your content. If you want to see how your content is performing or need strong data to demonstrate the ROI and growth of a campaign, make sure you’re measuring the four metrics I’ve listed below.

Photo by Maliha Mannan on Unsplash
Conversion Rate
Conversion Rate is the percentage of visitors who take desired actions on your website. This metric aid in the alignment of goals and, most importantly, profitability. A high conversion rate can depend on the interest level of the visitor, attractiveness of the offer, and the ease of process.
To track conversion rates on your site, log in to Google Analytics. It’s best to create a goal and find out what specific conversions you would like to measure. The Google Analytics Goals feature will help you track specific visitor activities and conversion rates. A conversion on a website can be a form fill, download, purchase or even a link click.
This helpful tutorial from Google shows you how to set up your goal and utilize the feature.
Content Reach
To put it simply, reach indicates the total number of users who view your content. Reach is another useful indicator of how your content is performing. When measuring reach it is important to account for unique users, the geography of the users, and the devices they are using to view your content.
Unique users: A unique user is an individual visitor to a website or recipients of specific content. This number helps you better understand the size and reach of your audience. To find this go to Google Analytics> Audience > Overview.
Geography: This helps you understand where in the world your users are consuming content and help you target effectively. To find this go to Google Analytics> Audience > Geo.
Device: How are users consuming your content? Are they using a desktop or mobile device? When you understand how people are consuming your content, you can optimize and format your content for mobile or desktop design. To find this go to Google Analytics > Audience > Mobile > Devices.
Page Views / Session
Page views per session measure the average of the number of pages viewed during a visit on your site and indicates how interesting users find your content. This is an important metric because it measures interest and how engaged users are with your content. By creating compelling articles, including internal links, and implementing page design the total number of pages viewed in a session will increase. According to Spinutech, you should aim for two or more page views per session.
You can also go to Google Analytics > Behavior > Behavior flow to follow the user’s journey through your site. The Behavior Flow Report visualizes the path a user follows from one page to the next. This report can help you identify paths on your site that are more popular than others and what content keeps users engaged on your site. You can also see connections and exits through the flow of your traffic. This is a more visual way of analyzing your traffic data and another great tool to utilize.
Brand Awareness
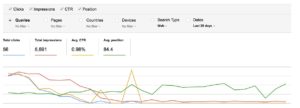
Brand awareness refers to the extent to which customers are able to recognize a brand. The best way to find the effectiveness of your brand is to go to Google Search Console > Queries > Impressions and select the impressions box. This page shows how many users are searching for your brand name.
Inbound links: Use Webmaster Tools to find what pages link to your site. Go to Google Search Console > Search Traffic > Links to your site
Social mentions: By searching your brand on Twitter or Facebook, you will find the total number of tweets or posts that contain your brand name. This gives you insight on how users are engaging with your brand on social media.
By paying close attention to these metrics, you will find what is working and what is not for your marketing campaign. Once you find out what works, you can harness this knowledge and continuously create compelling pieces of content.


Leave a Comment
You must be logged in to post a comment.