Engineers on social media: Data dump for marketers
A few months ago, we surveyed just shy of 1200 engineering and design professionals to learn about how they find and consume engineering information (the full research report it now available here). One area I was extremely curious about was social media.
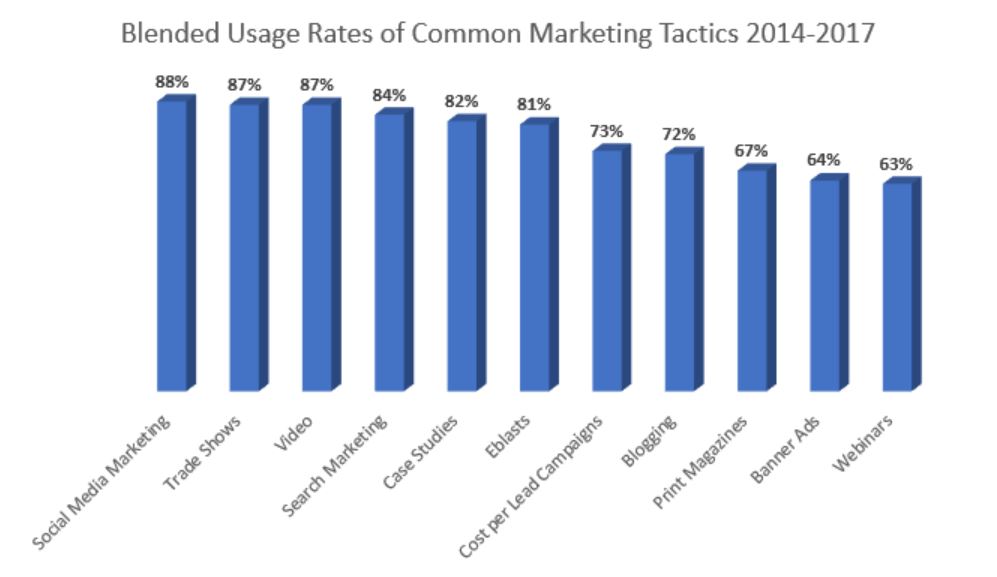
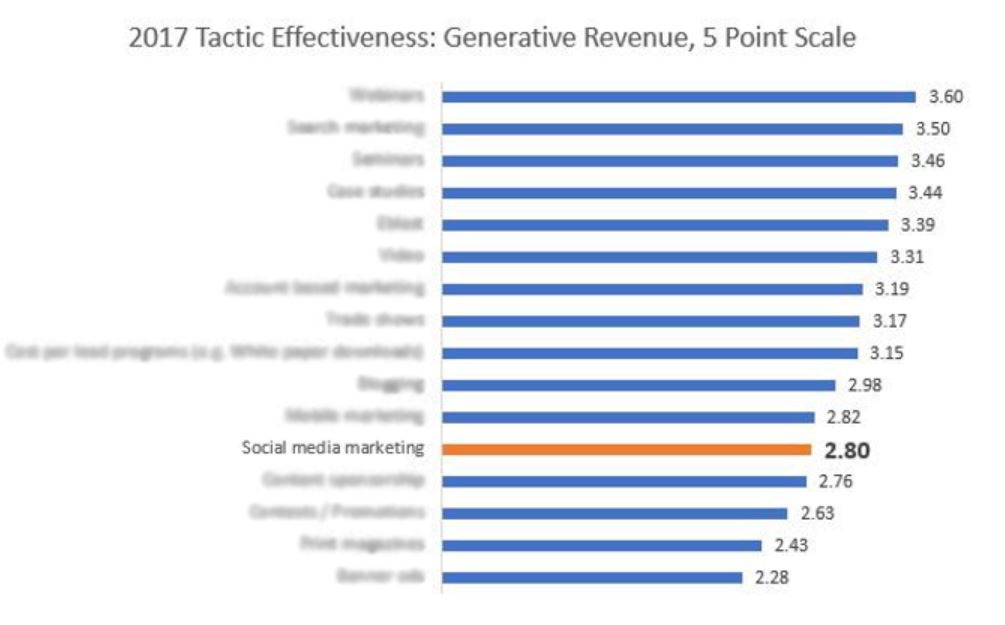
My curiosity stemmed from 2 seemingly counter-intuitive facts: 1) Social Media is the most commonly used engineering marketing tactic over the last 4 years & 2) It’s reported to be one of the least effective at generating revenue. This is evidenced by the following two charts:


Today, we’re going to answer some fundamental questions about engineers and social media using data from our recent survey of 1,187 engineers as well as web analytics data from ENGINEERING.com. The answers to the following questions should help us understand why marketers seem to have such difficulty in generating revenue from social media:
- Do engineers use social media for gathering work related material?
- Of those who do, what channels do they rely on?
- What types of content is best suited to reaching them?
Do Engineers Use Social Media to Gather Work Related Material?
Let’s look at two telling charts to begin. The first is based on a question we asked about the engineers’ content consumption over the last 30 days. The second is a question regarding the engineers’ preferred means of content consumption.


That’s a high degree of alignment. 41% said they gathered engineering content from social media, and 39% said they prefer getting content from the three big social channels. To ensure my analysis was airtight, I next compared the two groups expecting to find they overlap by close to 100%. Instead I found 63% overlap. That was pretty unexpected, so I decided to dig a little further. The following chart may be a little difficult to understand at first, so bear with me.

That big blue box is the 61% of engineers in our study that said the prefer accessing content through any and all means other than social media. The orange box next to it is the 39% who said they did hold a preference for accessing content through social media. Now, here’s where things get a little big tricky. The 61% in the blue box is subdivided further into pockets of 46% and 15%. Now, the 46% is a group that makes perfect sense, they’re people who said, “I don’t like social media and I didn’t access any content this past month from social media.” The 15% are the weirdos who said, “I don’t like social media, but yes, I recall reading some engineering content I found through social media last month.” If you’ve followed thus far, then explaining the orange box is easy; 39% said they had a preference for accessing content from social, which breaks out into 2 groups: 26% who make sense, “I like social, I access on social,” and 13% who do not, “I like social, no I didn’t access on social.”
So what does this all mean? Something interesting I hope. About 40% of engineers are actively looking for engineering content on social media. Then, there’s another 15% or so who are on social media for one reason or another, who from time-to-time will read a worked related article because it caught their eye.
Marketers can leverage this information to build better campaigns. For starters, expect that you can engage with an active 40% of your prospect pool on social. For example, you could use this information to benchmark the health of your social pages as a function of market size. Let’s say your estimates departments believes there are 200,000 industrial professionals who work in industries that could benefit from your solution. You can then set a target of some 80,000 Followers or Likes, just be sure to adjust for real accounts and bot accounts (especially on Twitter!).
A further tactic that this insight supports is creating shared interest content to connect with prospects who aren’t actively looking to engage with your company on social. What you do is ask yourself, “what do people who should like my product also like?” Then you create content that ties in with that other like. Here’s a really cool campaign we got to run just last year that puts this tactic to use perfectly.
This was a campaign we wrote about for Mouser, and hats off to them on this one. They paired their content with not one but two other areas of interest that their target audience likely holds interest in: Marvel Comics and MythBusters. This isn’t a tactic reserved for AAA campaigns though. You could just as easily test it out by mentioning how your collaborative robot does more than pass butter (Rick and Morty). Next, put a little bit of paid promotion behind it and have the content displayed to people whose industry is manufacturing and interest are Rick and Morty, or more generally science fiction, and boom, you can grab that other 15%.
They’re there, but where?
So we’ve established engineers are on social, but on which channels. I only have data on the platforms used for the engineers who said they prefer sourcing content from social channels, but the story the data is telling is pretty clear.

For me that’s a pretty big whoa moment. I expected LinkedIn to be the preferred channel given that we’re talking about content in the context of work related materials, but I did not expect it to be to this extent. If you were to restrict your social posting to just LinkedIn you’re going to reach 4 out of 5 engineers actively searching for content on social media.
I wanted to further corroborate these results, so I looked under the hood at the sharing of ENGINEERING.com’s editorial material via the tool Add This. If you’re unfamiliar with Add This, you can see what it looks like on to the right (you’ll likely have seen it all over the web). It’s a small plugin to a page that makes it easy for readers to share a story to their social media feed(s). It tracks social sharing through just the tool, not all social sharing, so keep that in mind. Here are the results from this tool for the last several months.

A few things should jump out at you. For starters, Facebook has the most overall shares. This isn’t entirely surprising given that it’s the largest social network. What’s really telling, and in line with what we’ve already seen, are those inbound clicks from LinkedIn compared to the other channels.
What we’re seeing makes sense. LinkedIn is a much narrower field of interest than Facebook with its mishmash of high school friends, people from your softball team, not to mention countless family members. As such, when you post a work relevant article to LinkedIn it follows that your peers, interested in the same processes and problems as you will investigate your posting. Facebook, well let’s just say my third baseman really does not hold an appreciation for fluid dynamics…
One small caveat worth mentioning. Not all posts/articles are created equal. Without digging into the data today, I can confidently tell you that those share-to-clicks aren’t telling you the full story. Rather, probably 10% of the articles posted account for 90% of all clicks back. Here on display is another one of social’s many frustrations for marketing: the viral post, but we’ll save that for another article.
Engineers on Social CHECK Engineers primarily on LinkedIn CHECK But what type of content?
To determine what works on LinkedIn for engineers we ran a number of statistical tests pitting engineers who prefer content from LinkedIn against all the other engineers in our sample. We were able to detect several telling statistical differences between the two groups that should help you in preparing content specifically for LinkedIn:
- White papers are a highly effective format in reaching engineers on LinkedIn. Engineers who use LinkedIn are 5x more likely to want to consume a white paper on a daily basis than their non-LinkedIn preferring counterparts.
- Engineers on LinkedIn are statistically much more likely to want to attend live local events. This is good to keep in mind when promoting a show or user group.
- Engineers active on LinkedIn are much heavier users of eBooks. They statistically differ from their peers in daily preference (2x), weekly preference (2x), and overall are significantly higher consumers of this product that other engineers.
- Video preferences are similar to eBooks for engineers on LinkedIn. Across the board – daily, weekly, and monthly engineers on LinkedIn are more likely to want content in this format than their peers not on the platform.
Here is a handy chart showing daily, weekly, and monthly LinkedIn content consumption rates broken down by various content types. It’s a handy tool to use when designing a campaign with mixed marketing materials. The last column provides an approximation of the likelihood that a contact who has followed your LinkedIn page will see your content assuming you’re posting semi-daily.

Closing
Thanks for your time in reading this massively long post on social media consumption by engineers. If you’d like to read the entire report upon which this research was based, you can download it here:
I hope you found this article informative. If you have any follow-up questions about this research please feel free to drop a comment bellow or reach out via LinkedIn or email. And since we’re talking about social media, please feel free to share amongst your friends on Facebook, Twitter, and above all else LinkedIn!
Until next time,
Andrew McWhaw


Leave a Comment
You must be logged in to post a comment.