

Measuring Social Media: The Most Important Engagement Metrics
The proliferation of social media in today’s society requires businesses to participate and engage with their audiences in this evolving and dominating media space. In doing so, it is important businesses understand how and which performance metrics to measure.
It’s easy to recognize some of the most important engagement metrics that are common among social media platforms, such as new likes, comments, shares, and etc. But what does that all mean, and how can you equate the metrics into ROI?
Don’t overcomplicate your social media metrics.
Metrics to Measure
Don’t get lost in the sea of analytic options. Focus on the following metrics to fine-tune your content and strategy, and improve ROI for your social media efforts. Regardless of which social channel your business is participating in, the most important engagement metrics to measure are relatively the same, although they may differ by name.
Reach (a.k.a. Impressions): The number of people your post is served to. The more engagement, the more potential for increasing your page’s reach.
Posts (Tweets): Number of posts you’ve posted to your account.
Page Likes (Followers): Total Page Likes is the number of unique people who like your Page.
Post Likes: The number of likes per post.
Demographics: Learn about your audience lifestyles, consumer behaviors, ages, gender, and digital footprint (mobile vs. desktop).
Best Times to Post: Identify the days and times when your audience is most active and likely to engage.
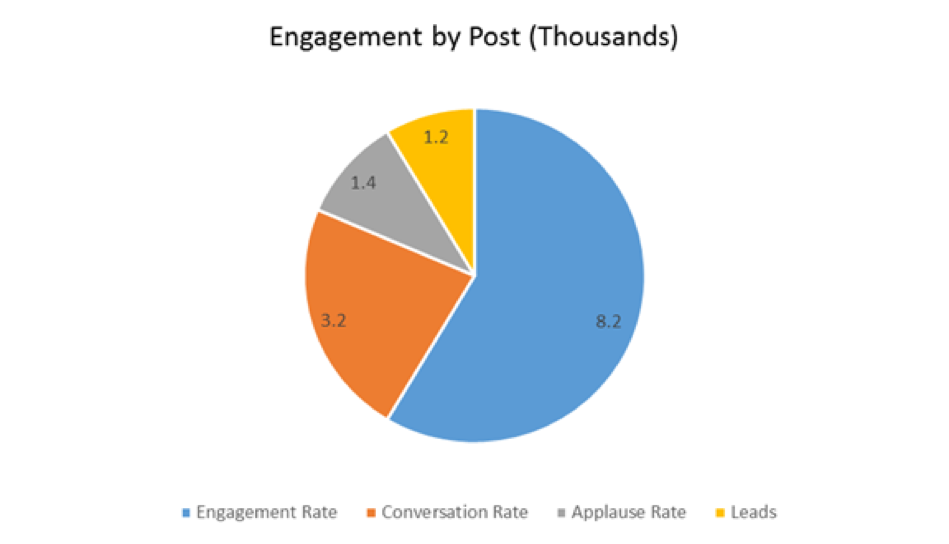
Don’t forget to measure the metrics in this chart.
Engagement: The number of unique people who have clicked, liked, mentioned, commented on, or shared your posts. Dig deeper, by measuring the following metrics, to elevate the meaning of your data:
Engagement rate: A cumulative number of link clicks, shares/retweets, likes and comments/replies of a post divided by the number of impressions.
Identify which posts are being shared, look for similarities and differences to determine what types of posts are getting the traction and attention.
The conversation rate, or ratio of comments per post to the total number of page followers.
Review the comments to gauge the effectiveness and relevancy to your audience and their needs.
The applause rate for your posts. The applause rate is the ratio of likes on a post to the number of page followers.
Leads: Attach a UTM code to your link to attribute leads to particular posts or paid campaigns.
For web referrals track the click-through with bounce rate to determine if you’re targeting the right audience. Compare traffic with click through rate by source, i.e., direct, search, social, etc. to leverage the value of traffic generated from social media.
Tying in Google Analytics
Tying the built-in social metrics together with Google Analytics will provide a comprehensive picture of performance, as well as how and where to improve the ROI for your business. Of particular importance are the metrics found under the Acquisition section.
The following metrics will identify which social channels are driving traffic and customers to your website.
- Sessions: The periods of time when a user is active on your website.
- Pageviews: Instances of a page being loaded (or reloaded) in a browser.
- Avg. Session Duration: The average length of sessions on your website.
- Pages / Session: The average number of pages viewed per session.
Google Analytics’ Social Conversions Report identifies which channels are leading to conversions on your website. Analyzing your social media performance metrics with built-in and third-party analytics will identify which channels work best for your business. Using this data effectively to guide the direction and focus of future posts and campaigns, can improve your social media results and improve your bottom line.


Leave a Comment
You must be logged in to post a comment.